Granular Reporting
Interactive dashboards allow you to visualize data by product, customer, entity, geography, cost center, and more
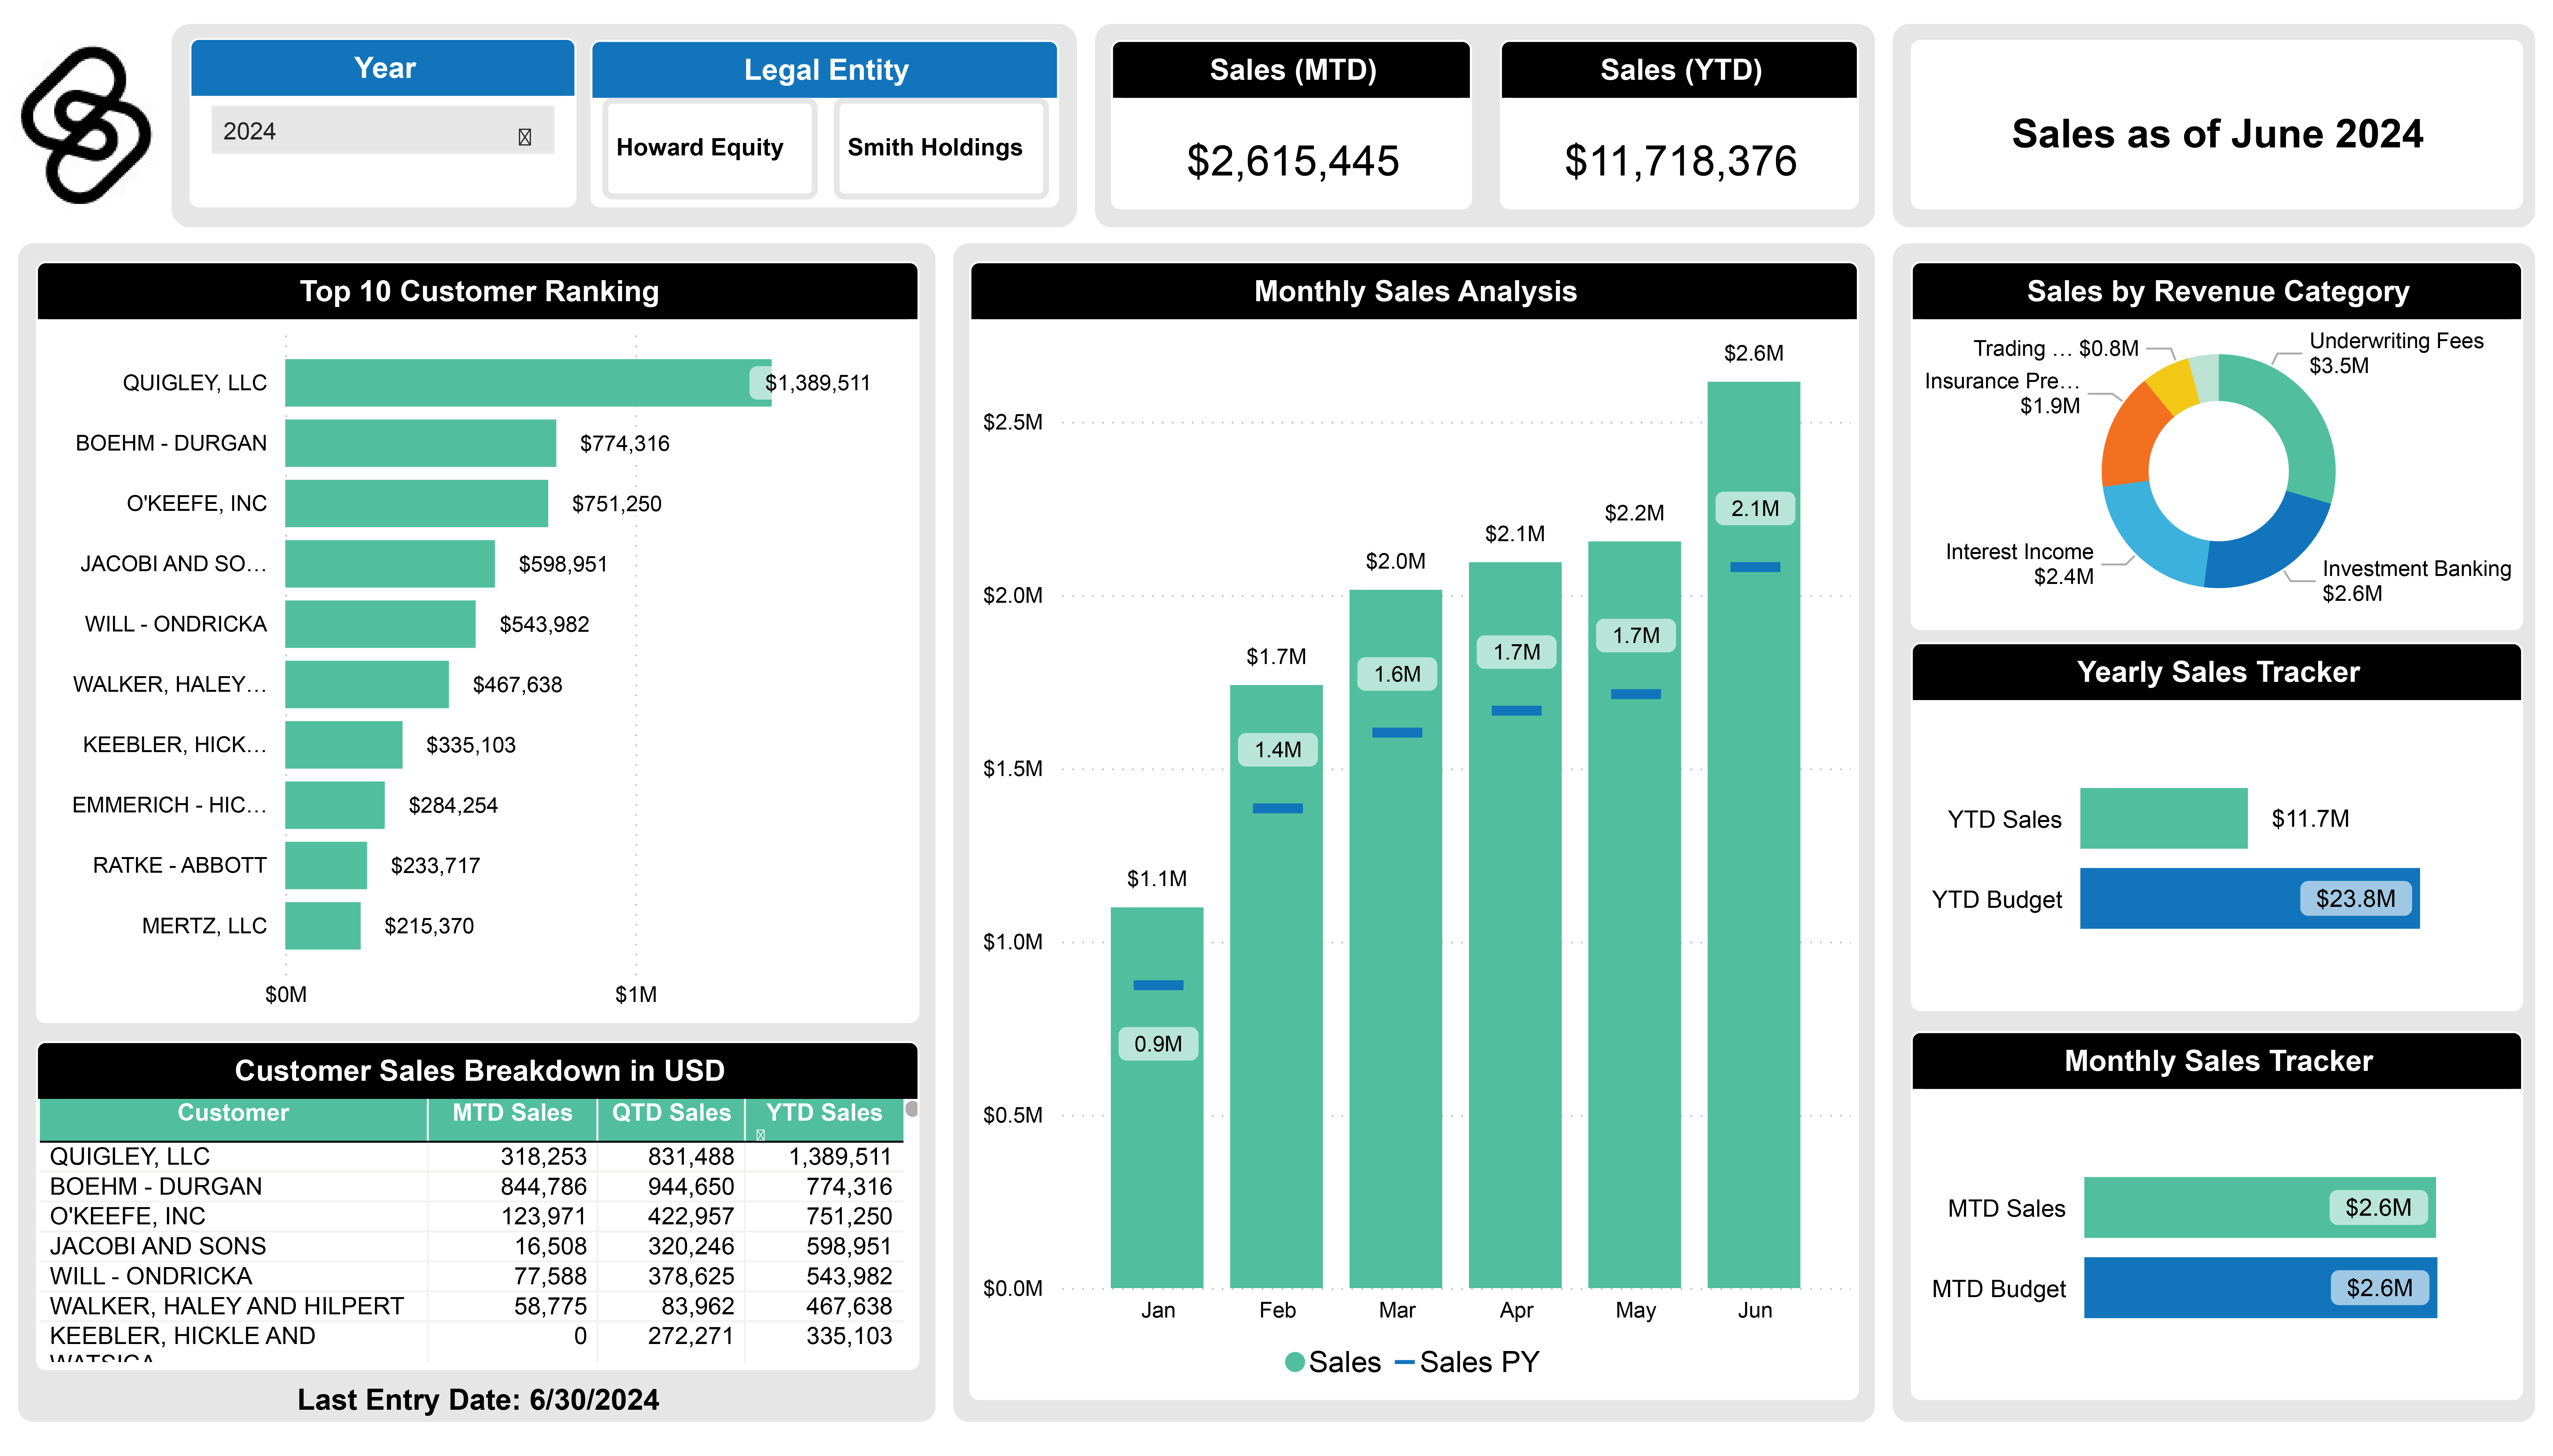
Results Comparisons
See how performance changes each month and compare results to budget and prior year in the click of a button
Multi-Currency Calculations
Our data visualization tools calculate multiple currencies to normalize results
Interactive Time Horizons
Report on YTD, QTD, TTM, and more as needed to drill down into specific time periods